What is the Local News Data Hub?
The Local News Data Hub’s goals are to i) shore up local journalism across Canada by supplying newsrooms with data-informed stories ii) train early-career data journalists and iii) collaborate with individual journalists and news outlets on local data journalism stories and projects.
The Data Hub’s reporting team consists of data journalists and data analysts who are either students or recent graduates. Working under the supervision of faculty at Toronto Metropolitan University, they identify government and other data with the potential to generate local stories for more than one community. Once a dataset has been analyzed and preliminary reporting has been completed, the Data Hub team reports and writes data-informed local stories, a process that in most cases involves producing one or more story templates that are then customized with data/content for specific communities. The local stories are posted on the LNDH website and available at no cost to any local news organization. Stories are also shared with the Canadian Press wire service for distribution to CP clients across the country. Find out more about the Local News Data Hub here.
Introduction and background
Our goal with this project was to produce national and local stories identifying which places in Canada have the highest concentrations of people 65 or older and what it is like for older adults living in those communities.
We used 2022 population estimates from Statistics Canada to identify municipalities where at least 25 per cent of the population has had a 65th birthday. Only places with at least 10,000 people were included in the analysis because that roughly aligns with Statistics Canada’s minimum population threshold to be considered an urban centre.
The final list included 111 census subdivisions – Statistics Canada’s term for municipalities including cities, towns and townships – that were then ranked based upon the percentage of people 65 or older in their midst.
We also examined Statistics Canada’s two-year health characteristics data to see how many people 65 or older do not have access to a regular healthcare provider. Statistics Canada publishes these data at the health region level but not at the smaller census subdivision (CSD) level. We dealt with this issue in the local stories by identifying which health region included the municipalities we wrote about and then citing data for those health regions.
The series includes a national story and three local stories we chose to do because there are different reasons for the burgeoning populations of older adults in each of them. We wrote about first-ranked Parksville, B.C., a city of approximately 14,000, because its climate and idyllic scenery are a draw for older people. Third-ranked Elliot Lake, Ont. was the focus of a story because, in the years since the last local uranium mine closed in 1996, the northern Ontario city has worked to attract older residents by marketing its affordability and location in pristine wilderness. The series also includes a story about eighth-ranked Bathurst, N.B., a city where the population is aging, in part, because so many young people leave for other job opportunities. More recently, older people attracted by the city’s location on Chaleur Bay and its relatively affordable housing have also been moving into the community.
Definitions
Census Subdivision (CSD) – The general term for municipalities (as determined by provincial/territorial legislation) or areas treated as municipal equivalents for statistical purposes (e.g., Indian reserves, Indian settlements and unorganized territories). Municipal status is defined by laws in effect in each province and territory in Canada.
Census Agglomeration (CA) – A CA is formed by one or more adjacent municipalities centered on a population centre (known as the core). A CA must have a core population of at least 10,000 based on data from the previous Census of Population Program. To be included in the CA, other adjacent municipalities must have a high degree of integration with the core, as measured by commuting flows derived from data on place of work from the previous Census Program.
Has a regular healthcare provider – Population aged 12 and over who have a health care provider they regularly see or talk to when they need normal care or advice for their health. A regular health care provider is defined as a health professional that a person sees or talks to when they need care or advice about their health. This can include a family doctor or general practitioner, medical specialist, or nurse practitioner.
Health Region (HR) – Legislated administrative areas defined by provincial ministries of health. These administrative areas represent geographic areas of responsibility for hospital boards or regional health authorities. For the most part, health regions can be described as groupings of counties (census divisions) or municipalities (census subdivisions).
The data source
Population estimates
The stories in this project are based on analysis of Statistics Canada’s population estimates for census subdivisions as of July 1, 2022. They provide the most current population counts and age data.
We focused on census subdivision-level data, the general term for municipalities (as determined by provincial/territorial legislation) or areas treated as municipal equivalents for statistical purposes.
Statistics Canada releases annual population estimates based on the 2016 census boundaries corrected for people who were not counted and unenumerated Indigenous reserves. Components of demographic growth derived from other government data are also added to obtain the annual population estimates. These include provincial vital statistics including births and deaths, international migration data from Immigration, Refugees and Citizenship Canada, and tax data that is used to track internal migration numbers.
“The estimates are very solid, they are not a secondary product,” said Sebastien Lavoie, an analyst at Statistics Canada’s Centre for Demography. “When it comes to population and the movement of people, estimates are currently still the way to go.”
Family doctor data by health region
Statistics Canada published health data for health regions in 2022 based on information collected from the annual Canadian Community Health Survey (CCHS). The published data includes the variable “has a regular healthcare provider,” which is the number of people aged 12 and over who have a health care provider they regularly see or talk to for health care and advice. Data for the total number and percentage of people who have a regular healthcare provider for health regions were used to calculate health region populations. Data for the number and percentage of people 65 and older who have a healthcare provider were used to calculate the number and percentage of people 65 and older who do not have a regular healthcare provider for all health regions that contain the 111 communities included in this project.
Because data is only available at the health region level of geography, we used a Statistics Canada data file that lists every CSD and its associated health region in Canada to identify which health regions included the 111 census subdivisions that were the focus of our analysis. Not all health regions align with census subdivision boundaries, so we also used this Statistics Canada table, which lists all the CSDs in the country that fall into more than one health region.
In two of the three CSDs that are served by more than one health region – Kawartha Lakes and West Grey – more than 99 per cent of the population were concentrated in one health region, so we categorized them accordingly. A third CSD, Tracadie, N.B., had a more even split between health regions. Healthcare provider information was therefore recorded for both health regions for that CSD.
Analyzing the data
The Statistics Canada population estimate data for all provinces and territories were analyzed using Python. The Local News Data Hub’s team member responsible for data analysis and coding support for Local News Data Hub projects wrote a Python program to filter the data to only include census subdivisions with populations of 10,000 or greater and to calculate age variables. The Python libraries Pandas and NumPy were imported to assist with data analysis. Pandas was used to create data frames – two-dimensional data structures arranged like a table, with rows and columns. NumPy was used to rename Statistics Canada’s two-digit classification number to the corresponding province/territory name (for example, ’35’ was replaced with ‘Ont.’).
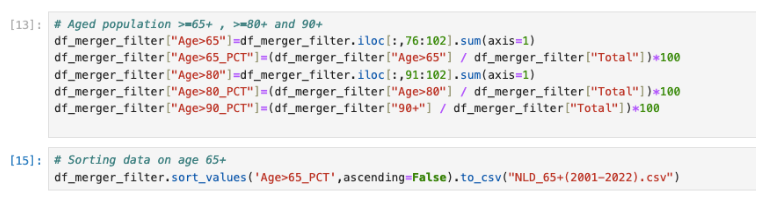
The Python program included the following code to calculate the 65+ and 80+ variables as well as the percentage of the population 65+, percentage of the population 80+ and percentage of the population 90+ variables for census subdivisions that have a total population of 10,000 or more. The data were then sorted in descending order by the percent of the population 65+ variable.
According to Statistics Canada, the share of the population that is 65 or older jumped to nearly 19 per cent in 2022, up from 14 per cent in 2010. That number is expected to stabilize around 25 per cent by the middle of the century.
Knowing this, and after comparing the 65+, 80+ and 90+ variables, the LNDH team determined that only census subdivisions where 25 per cent or more of the population was aged 65 or older would be included in the analysis of aging communities.
The Python program and ranking was reviewed by Lavoie at Statistics Canada.
Key findings
There were 111 CSDs (population greater than 10,000) where at least 25 per cent of residents were 65 or older. The 20 municipalities at the top of the list are shown below.
Table 1. 20 CSDs (population 10,000+) with the highest percentage of older adults
| Rank | Municipality | Population | People 65 or older | Percentage 65 or older | People 80 or older | Percentage 80 or older |
|---|---|---|---|---|---|---|
| 1 | Parksville, B.C. | 14164 | 6527 | 46.08 | 1777 | 12.55 |
| 2 | Sidney, B.C. | 12569 | 5449 | 43.35 | 1812 | 14.42 |
| 3 | Elliot Lake, Ont. | 11551 | 4846 | 41.95 | 1105 | 9.57 |
| 4 | Sechelt, B.C. | 11238 | 4382 | 38.99 | 1218 | 10.84 |
| 5 | Saint-Charles-Borromée, Que. | 15466 | 5796 | 37.48 | 1983 | 12.82 |
| 6 | White Rock, B.C. | 21807 | 7965 | 36.52 | 2218 | 10.17 |
| 7 | Wasaga Beach, Ont. | 25143 | 9059 | 36.03 | 1706 | 6.79 |
| 8 | Bathurst, N.B. | 12370 | 4410 | 35.65 | 1223 | 9.89 |
| 9 | Cobourg, Ont. | 21077 | 7476 | 35.47 | 2324 | 11.03 |
| 10 | Saint-Sauveur, Que. | 11618 | 4108 | 35.36 | 1068 | 9.19 |
| 11 | North Saanich, B.C. | 12671 | 4409 | 34.80 | 783 | 6.18 |
| 12 | Oak Bay, B.C. | 19211 | 6571 | 34.20 | 1811 | 9.43 |
| 13 | Niagara-on-the-Lake, Ont. | 18981 | 6339 | 33.40 | 1480 | 7.80 |
| 14 | Prince Edward County, Ont. | 26816 | 8923 | 33.27 | 2121 | 7.91 |
| 15 | Lambton Shores, Ont. | 11561 | 3829 | 33.12 | 787 | 6.81 |
| 16 | Saltspring Island, B.C. | 11828 | 3912 | 33.07 | 776 | 6.56 |
| 17 | Brighton, Ont. | 13009 | 4297 | 33.03 | 960 | 7.38 |
| 18 | Magog, Que. | 28198 | 9104 | 32.29 | 2267 | 8.04 |
| 19 | Comox, B.C. | 15378 | 4957 | 32.23 | 1442 | 9.38 |
| 20 | Summerland, B.C. | 12918 | 4142 | 32.06 | 1210 | 9.37 |