What is the Local News Data Hub?
The Local News Data Hub is committed to i) shoring up local journalism across Canada by supplying newsrooms with data-informed stories ii) training student data journalists and iii) collaborating with individual journalists and news outlets on local data journalism stories and projects.
This project is the result of a collaboration with the Investigative Journalism Foundation (IJF), a non-profit journalism startup that is tracking political donations and lobbyist activity in partnership with university researchers.
The Data Hub’s reporting team, consisting of student data journalists and student data analysts supervised by faculty at Toronto Metropolitan University, identifies datasets produced by government offices and other institutions of interest to local news audiences. Once a dataset is cleaned and analyzed, Data Hub journalists do the necessary reporting and then write a story template that can be populated with data for specific communities. The local stories produced using this application of automated journalism are then posted on the LNDH website and also shared with the Canadian Press wire service for distribution to CP clients across the country. Find out more about the Local News Data Hub here.
Introduction and background
The purpose of this project was to produce national and local stories exploring how much money was raised by federal political parties, candidates and riding associations in federal electoral districts across Canada and to explore what, if any, impact these donations have.
We looked at donations by riding dated from Oct. 20, 2015 – one day after the 2015 federal election – to Dec. 31, 2020. This time period included donations related to the 2019 federal election. We excluded 2021 data because not all the donation information had yet been submitted to Elections Canada by the various political entities in early 2022 when we downloaded the data and began work on the analysis.
The detailed analysis focused on the 17 ridings in the 95th percentile for total donations, meaning 95 per cent of all ridings donated less money. We also produced a series of stories that focused on ridings covered by Village Media publications in Ontario.
Total donations were calculated based on contributions greater than $200 made to candidates, political parties and electoral district associations. It did not include donations related to by-elections or leadership campaigns during this time period because we wanted to analyze comparable data for all ridings.
The dataset was downloaded from Elections Canada and cleaned by developers at the Investigative Journalism Foundation to remove duplicate information, correct for errors in riding names, and address other inconsistencies. For donations greater than $200, the dataset contained information on both recipients and donors including the name of the recipient (candidate, political party or electoral district association), their political party, the full name of the donor, the donor’s postal code and the amount donated.
Definitions
Audits: Elections Canada has a risk-based audit approach for audit activities related to political donations. Returns are selected for audit on the basis of the level of risk of non-compliance with the Canada Elections Act. Data analytics help focus audits in areas where the likelihood and severity of risks are the greatest while at the same time identifying possible anomalies. Not all returns are selected for an audit.
Donation date: The date a political donation is received by the official agent for candidates, the chief agent or an authorized registered agent for registered parties, or the financial agent for electoral district associations. This is the date that is recorded in the financial returns of these three political entities. Candidates, registered parties and electoral district (riding) associations have different submission deadlines for their financial returns. Information on the deadlines can be found on Election Canada’s website.
Event date: The date the electoral event took place.
Elector: A person who is a Canadian citizen at least 18 years old, and therefore eligible to vote.
Electoral district (also known as a riding or constituency): A geographical area represented by a member of the House of Commons.There are 338 federal electoral districts in Canada.
Electoral event: A generic term used by Elections Canada to describe a general election, by-election or referendum in the donations dataset. There are also donations made under the electoral event “Annual,” which is for donations made to political entities (candidates, electoral district associations, parties) outside of an electoral event. For the purposes of this analysis, we looked at donations related to the 2019 election and Annual donations. Donations related to by-elections, and non-electoral events such as riding nomination contests and leadership contests, were excluded from the analysis so that we had comparable data for all ridings and parties.
Data as submitted: Financial reporting data as filed by the political entity (candidates, political parties, electoral district associations, leadership contestants and nomination contestants).
Data as reviewed: Financial reporting data that may include updates to the original return by the agent and minor corrections made by Elections Canada. This dataset is also referred to as “audited” or “amended” data.
Median total income in 2015 among income recipients ($): The median income is the value for which half of the units in the population have lower incomes and half have higher incomes. To derive the median value, units are ranked from lowest to highest according to their income and then separated into two equal-sized groups. The value that separates these groups is the median income (50th percentile). If there is an even number of units, the median will be the average of the two middle-ranked values. Median total income among recipients only looks at Statistics Canada data for individuals with earnings in 2015, and does include people with no income.
Political entities
- Registered party: A political party that runs at least one candidate in a general election or by-election and complies with the requirements of the Canada Elections Act may be registered. Benefits of registering with the Chief Electoral Officer include having the party name appear on the ballot, the right to issue tax receipts for monetary contributions, and partial reimbursement of election expenses. Registered parties must disclose their contributions received, election spending and other financial information.
- Candidate: A person who seeks election to public office. A candidate running in a federal election or by-election is trying to be elected a member of Parliament.
- Electoral district associations (also known as a riding association or a constituency association): A local association of members of a political party in an electoral district. If the electoral district association of a registered political party wants to accept contributions, provide goods and services or transfer funds, it must apply to the Chief Electoral Officer to be registered.
The following two entities are not included in the Data Hub/IJF analysis:
- Leadership contestants: A person seeking to be the leader of their federal political party.
- Nomination contestants: A person seeking to be named the official candidate of their political party in an electoral district during an election.
Political donation or contribution: A contribution is donated money (monetary contribution) or donated property or services (non-monetary contribution). Elections Canada rules allow an individual to donate a maximum of $1,675 to each registered political party on an annual basis. The same individual can also contribute $1,675 in total to all contestants in a party leadership race and spend an additional $1,675 per party among candidates in an election, nomination contestants and local electoral district associations.
Political donations greater than $200: When total contributions from an individual are greater than $200, their name, postal code and contribution amounts are disclosed in the financial return and will be published on the Elections Canada website.
Political donations less than $200: When total contributions from an individual are between $20 and $200, the person’s full first and last names must be recorded. The names of these donors, however, are not published by Elections Canada. Anonymous contributions of $20 or less can be accepted.
In the donations dataset, Elections Canada aggregates donations of less than $200 for each recipient, year and electoral event as one row, meaning these rows do not contain any geographic location information (city, postal code) on the donors.
Registered voter: A Canadian citizen aged 18 or older on election day with acceptable proof of identity and address that has registered with Elections Canada either at the polls or in advance.
95th percentile: The percentile of a given value is determined by the percentage of the values that are smaller than that value. The 95th percentile means that this value is greater than 95 per cent of values in a given set. For the donations stories, ridings in the 95th percentile have a total donation amount from all donors that is greater than 95 per cent of total donations for Canada’s 338 ridings.
Voter turnout: The percentage of registered voters who cast a ballot in an election.
Contributor: An individual who is a Canadian citizen or permanent resident of Canada and has made a contribution to a registered party, a registered association, a candidate, a leadership contestant or a nomination contestant. Elections Canada states that “contributions can be accepted from minors, but political entities should consider whether the person is contributing willingly and using their own property or money.”
Analyzing the data
The data source
The Local News Data Hub and Investigative Journalism Foundation cleaned and analyzed two datasets of donations to Canadian political entities that were downloaded from the Elections Canada website. There are two files: “Contributions as submitted” (od_cntrbtn_de_e.csv) and “Contributions as reviewed” (od_cntrbtn_audt_e.csv) on the Elections Canada website, which are updated weekly. The files used in this project were downloaded in February 2022. For this series of stories, we looked at the breakdown of total donations by riding dated from Oct. 20, 2015 – one day after the 2015 federal election – to Dec. 31, 2020.
The final dataset included donations greater than $200 made to candidates, political parties and electoral district associations over the five-year period for each riding, which included the 2019 federal election. It did not include donations related to by-elections, leadership campaigns or riding nomination contestants during this time period because we wanted to analyze comparable data for all ridings.
The dataset has a separate column showing total donations of less than $200 received by electoral district associations and candidates of each riding. Elections Canada does not publish the names and postal codes for donations less than $200. As a result, information was available on where the donated money went, but it was impossible to determine where the donor lived.
Cleaning the raw data
First, we downloaded the data for donations as submitted by political entities to Elections Canada and the dataset for donations audited by Elections Canada. We opened these datasets in a Jupyter Notebook, a tool to analyze data using the Python programming language.
We ran a function on both datasets to clean misspelled or outdated electoral district names, for instance, replacing “Peterborough” with “Peterborough–Kawartha.” Misspellings and inconsistencies in provincial and territorial names were also reviewed, for example, replacing “ON”, “on”, “ONT”, “Ont” with “Ontario”. Standardizing riding names is essential for accurately counting donations by riding.
To delete duplicates of the same donation, we checked for duplicates of the recipient, year and party, between annual, quarterly, weekly and contestant leadership returns. If an annual return existed for that recipient, year, party, we deleted the other returns (quarterly, weekly, contestant). If an annual return didn’t exist for that recipient, year, party, and a quarterly return existed for that recipient, year, or party, we deleted everything below quarterly (weekly, contestant). We did the same for weekly returns and contestant leadership returns.
Elections Canada does not audit all submitted donations, so we merged the two datasets and checked for duplicates.
To check for duplicates, we ran a function that checked both datasets to see if there were matches in four columns: recipient, political party, electoral event and year. These are the columns that Elections Canada checks in its auditing process. If exact matches in these four columns existed between the two datasets, we deleted the submitted data and kept the audited data. If there were no matches, we kept the submitted data.
Finally, we deleted multiple columns from the raw data from our final dataset where they were not relevant to our investigation. These were the columns in our final dataset – the names in brackets are the exact names of the columns:
- Political Entity (political_entity)
- Recipient ID (recipient_id)
- Recipient (recipient)
- Political Party of Recipient (political_party)
- Electoral District (electoral_district)
- Electoral Event (electoral_event)
- Fiscal/Election Date (event_date)
- Financial Report (financial_report)
- Financial Report Part (financial_report_part_no)
- Contributor Name (donor_full_name)
- Contributor Last Name (donor_last_name)
- Contributor First Name (donor_first_name)
- Contributor City (donor_city)
- Contributor Province (donor_province_territory)
- Contributor Postal Code (donor_postal)
- Contribution Received Date (donor_donation_date)
- Monetary Amount (amount_monetary)
- Non-Monetary Amount (amount_non_monetary)
We also calculated new columns for:
- “Amount_total,” which added ‘Monetary amount’ and ‘Non-Monetary amount’
- “Donor_fsa,” which extracted the forward sortation area (FSA) of the donor from the donor’s postal code
- “Year,” which extracted the year from the ‘Contribution Received date’ column.
Applying filters to cleaned dataset
After creating the final, merged donations dataset from submitted and reviewed data, we applied specific filters.
We filtered the dataset to only include donations from Oct. 20, 2015 (one day after the 2015 election) to Dec. 31, 2020, using the donation date column. We applied a filter that only kept donations with an electoral event of “Annual” or “43rd general election,” which is the 2019 election. For example, in our dataset, donations to electoral district associations and political parties not related to the 2019 election would have “Annual” in its electoral event column. We filtered out other electoral events such as any donations related to the 2015 election and any donations related to by-elections, nomination contests and leadership contests that occurred during this time period.
Creating the donor electoral district column using postal codes
Once we had applied these filters, we were able to identify the electoral district of donors in the dataset by using their postal codes. To do this, we cleaned and then merged Statistic Canada’s “Postal Codes by Federal Ridings File (PCFRF) 2013 Representation Order, March 2022 Postal Codes” with the donations dataset based on the donor postal code column.
Out of the 2,355,213 rows in the donations dataset, 23,441 (0.1 per cent) do not have a donor electoral district. There were 9,118 rows from the donations dataset without a donor postal code (including the aggregated contributions of less than $200 rows). There were 14,325 rows (2,099 unique postal codes) in the donations dataset with a postal code value that did not match with a postal code from Statistics Canada’s PCFRF file.
Creating the total amount dataframes
After adding the donor electoral district column to the donations dataset, we created a dataframe of donations greater than $200 by donor electoral district. Dataframes are two-dimensional data structures arranged like a table, with rows and columns. To create the total donations dataframe, we grouped the donations dataset by the donor electoral district and then summed all of the donations.
Donations of less than $200 were not included in the totals because they are aggregated by recipient and electoral event and appear as one row in the Elections Canada donations dataset under the donor name “Contributions of $200 or less/contributions de 200 $ ou moins.” This meant they had no values in the donor postal code column and we could not derive donor electoral districts from these rows. There is no accurate way of determining which electoral district donations of less than $200 come from.
While we could not determine the location of the donors who donated less than $200, we were able to create another dataframe of total donations less than $200 that riding associations and candidates in each riding received. This was calculated by by summing all the rows of aggregate donations less than $200 (listed under the donor name as ‘Contributions of $200 or less/contributions de 200 $ ou moins’ and ‘Contributions of $20 or less/contributions de 20 $ ou moins’) by the riding of the recipient. This dataframe excludes political parties as recipients because they do not reside in one particular riding.
This variable, combined with the per party total of donations that were greater than $200 allowed us to calculate the total amount raised by each party over the five-year period.
Merging with other datasets
We merged these dataframes with additional data pulled from other sources so we could analyze trends and correlations. These variables included:
- Median income data: Statistics Canada has 2016 census data for federal electoral districts. In our analysis, we looked at the median total income in 2015 in each of the 338 ridings and compared it against the national median total income value ($34,204) to see which of the 17 ridings in the 95th percentile of total donations fell above the national value. The 2016 census captures 2015 income data. We downloaded and compared the list of electoral district names with the electoral district names from our donations dataset to identify differences (ex. Mount Royal in the donations dataset versus Mont-Royal in the census data). After standardizing all 338 electoral district names, we created a table of the “Median total income in 2015 among recipients ($)” column from the 2016 census by electoral district.
- 2019 voting results: We downloaded the results of the 2019 federal election by electoral district and compared the list of electoral district names with the electoral district names from our donations dataset to identify differences. Elections Canada datasets typically list the English and French names of the electoral districts, separated by a slash (ex. “Northwest Territories/Territoires du Nord-Ouest”) whereas our donations dataset only has the English names of the districts. The cleaning process involved deleting the French names from the electoral district column.
After standardizing all 338 electoral district names, we created a table with the number of electors, voter turnout, elected candidate and political affiliation by electoral district. We also created a separate column that extracted the full name of the party from the elected candidate column (ex. “New Democratic Party” from “Singh, Jagmeet NDP-New Democratic Party“).
The Table 11: Voting results by electoral district CSV file can be downloaded from Elections Canada.
- Cabinet minister positions: We downloaded a dataset of previous cabinet ministers from Parlinfo. We uploaded this file in Excel and created a separate sheet with all 338 elected candidates from the 2019 election, and matched them to the list of previous cabinet ministers in the Parlinfo. For candidates who did not appear in the cabinet minister file, we listed them as having “No position.” We only matched elected candidates with their cabinet minister position if they served directly prior to the 2019 election. After uploading this cleaned file to Jupyter Notebooks, we merged this cabinet minister dataframe with the 2019 candidate results dataframe using the list of candidate names as the joining column.
- Party leaders: We copied and pasted the list of 338 elected candidates from the election into Excel and created another column to denote which elected candidates were party leaders going into the 2019 election. For candidates who were not party leaders, the column value would be “N/A”. After uploading this cleaned file to Jupyter Notebooks, we merged this party leaders dataframe with the 2019 candidate results dataframe using the list of candidate names as the joining column.
After creating tables for the above mentioned datasets with the standardized electoral district names, we merged all of these tables with the donations by electoral district dataframe, using the electoral district names as the common column.
Once we had a final dataset, members from both the Local News Data Hub team and Investigative Journalism Foundation vetted all of the merging code. They ran the same Jupyter Notebook on their own devices to replicate the merging process. After vetting, our reporter did a series of manual checks on the raw data on groups of 15 randomly-selected electoral districts to confirm that all of the data had been merged correctly and the correct values were in the correct columns.
About the Local News Data Hub analysis
The final dataset we worked with contained the following columns for all 338 electoral districts. This final data set and the data dictionary are available here.
- Donor electoral district: Our dataset is grouped by the donors’ electoral district, which we identified using the Statistics Canada PCFRF postal code to electoral district conversion file. We identified donor electoral districts using the donor’s postal code.
- Province/territory: The province or territory of the donor is a column in the raw Elections Canada donations data.
- Party that received the most donations from this riding: This column was calculated by grouping the donations data by donor riding and political party and then summing the total amounts. We then used a function to identify which party received the most money from the riding, and created two separate columns for the name of the top party, and the amount they received. This column represents the political party of all entities, including candidates, electoral associations and federal parties. For example, the party that received the most donations in Ottawa Centre was the Liberal Party, which means Ottawa Centre residents mostly donated to Liberal Party entities, including candidates, riding associations and the national party.
- Party that held this riding prior to 2019 election: The party that held this riding directly prior to the 2019 election. This column was taken from a list of members of parliament in the 42nd Parliament.
- Winning party in 2019 election: The political party of the elected candidate that won in this riding in the 2019 election. This column was taken from the 2019 voting results dataset.
- Elected candidate: The name of the elected candidate in the 2019 election. This column was taken from Election Canada’s 2019 voting results dataset.
- Status at Election: The status of the candidate during the 2019 election. Either “Incumbent (Elected at the previous election)” or “First Time Elected.” This column was taken from Parlinfo.
- Cabinet minister/former cabinet minister positions: Former minister positions held by the elected candidate directly prior to the 2019 election. We uploaded a Parlinfo file of previous cabinet ministers in Excel, created a separate sheet with the names of the 338 elected candidates from the 2019 election, and matched them to the list of previous cabinet ministers from the Parlinfo file. For candidates who did not appear in the cabinet minister file, they had “No position.” For candidates who did appear in the cabinet minister file, we manually inputted the name(s) of their position(s). We only matched elected candidates with their cabinet minister position if they served directly prior to the 2019 election. The resulting file was then uploaded to Jupyter Notebooks.
- Party leader: If the candidate was a party leader, the name of the party that the elected candidate is the leader of was entered. If the candidate was not a leader, the column appears as “N/A.” This was manually done by searching the names of all party leaders in the elected candidate column and filling in their party name.
- Total donations less than $200 that riding associations/candidates in this riding received: The total amount of donations less than $200 that riding associations or candidates in this riding received. These donations are not necessarily from donors within this riding. This was calculated by summing all the rows of aggregate donations less than $200 (listed under the donor name as ‘Contributions of $200 or less/contributions de 200 $ ou moins’ and ‘Contributions of $20 or less/contributions de 20 $ ou moins’) by the recipient riding.
- Total donations to all political entities (greater than $200): The total amount of donations greater than $200 from donors in this riding to all political entities (candidates, riding associations, parties).
- Percentage of donations that went to parties: The percentage of total donations greater than $200 that went to federal parties.
- Percentage of donations that went to association in same riding: The percentage of total donations greater than $200 that went to a riding association in this riding.
- Percentage of donations that went to association in different riding: The percentage of total donations greater than $200 that went to a riding association in a different riding.
- Percentage of donations that went to candidate in same riding: The percentage of total donations greater than $200 that went to a candidate in this riding.
- Percentage of donations that went to candidate in different riding: The percentage of total donations greater than $200 that went to a candidate in a different riding.
- Amount top party received: The total amount of donations greater than $200 that the most donated-to party in this riding received (for example, the party that received the most donations in Ottawa Centre was the Liberal Party, which received $3,329,880.42 from donors in Ottawa Centre).
- Percentage of donations to top party: The percentage of total donations greater than $200 that the most donated-to party in this riding received (for example, the party that received the most donations in Ottawa Centre was the Liberal Party and they received 56.4% of total donations greater than $200 from donors in Ottawa Centre).
- Median total income in 2015 among recipients ($): The median income of this riding based on the Statistics Canada 2016 census.
- Voter turnout (2019): The voter turnout of this riding in the 2019 election. This column was taken from Election Canada’s 2019 voting results dataset.
- Number of registered voters: The number of registered voters in this riding in 2019. This column was taken from Election Canada’s 2019 voting results dataset.
- Number of unique donors: The number of unique donors who contributed more than $200 in this riding. This was calculated by grouping the donations dataset by riding and counting the number of unique values in the donor full name column.
- Average donations per donor: The average donation amount per unique donor. This was calculated by dividing the total donations greater than $200 amount by the number of unique donors.
- Number of unique donors per 10,000 registered voters: The number of unique donors per 10,000 registered voters was calculated by dividing the number of unique donors in this riding by the number of registered voters in this riding and multiplying by 10,000.
Key findings
Counting donations that were greater than $200 and donations of less than $200 to federal parties, candidates and riding associations over the five years, the Conservative Party of Canada raised the most money, raking in nearly $179 million. The Liberals amassed $141.6 million, the NDP raised $52 million, the Green Party raised $24 million and the Bloc Québécois collected $6.7 million.
Most of the analysis focused on the 17 ridings in the 95th percentile for donations of greater than $200 to federal political parties. Our analysis found that ridings where people donated the most money tended to be in urban areas, higher income and home to high-profile candidates.
Ridings in the 95th percentile for total donations greater than $200 ridings (total donations greater than 95 per cent of all ridings in the country) were as follows:
- Ottawa Centre: $5.9 million
- University-Rosedale: $5.4 million
- Toronto-St. Paul’s: $4.1 million
- Calgary Centre: $4 million
- Don Valley West: $3.4 million
- Vancouver Quadra: $3.3 million
- Ottawa-Vanier: $3.1 million
- Vancouver Centre: $2.7 million
- West Vancouver-Sunshine Coast-Sea to Sky Country: $2.6 million
- Victoria: $2.6 million
- Saanich-Gulf Islands: $2.5 million
- Notre-Dame-de-Grâce-Westmount: $2.3 million
- Winnipeg South Centre: $2.3 million
- Vancouver Granville: $2.3 million
- Eglinton-Lawrence: $2.3 million
- Oakville: $2.2 million
- Edmonton Centre: $2.1 million
The average total donation over $200 per riding was $852,738.06, which we calculated by adding the total donations of each riding and dividing by 338.
We determined that most of the top 17 ridings were in or close to major cities by looking at their geographical location. Many of the riding names included the name of the city it is located within (ex. Vancouver Centre, Edmonton Centre, Toronto-St.Paul’s). For other ridings, we checked their location using Election Canada’s electoral district boundaries maps.
There was also a significant proportion of former ministers among the elected candidates of these top 17 ridings – seven were cabinet ministers prior to the election.
Most of the ridings included affluent neighbourhoods: We assembled multiple lists of the most wealthy neighbourhoods in Canada, including articles from Canadian Business, Narcity, and other publications. We then identified neighbourhoods that fell into the boundaries of the top 17 ridings by using Elections Canada’s electoral district boundaries maps and the boundaries of the affluent neighbourhoods found in their respective city government websites and open data portals.
We also compared the 2019 election voter turnout in each of the top 17 ridings with the national voter turnout of 67 per cent. We used a COUNTIF statement in Excel that counted how many of the 17 ridings had a turnout greater than 67. We found that 13 out of the 17 ridings had a voter turnout above 67 per cent.
We calculated the average number of donors per riding by adding up the number of donors who contributed more than $200 in each riding and dividing by 338.
We then asked a series of questions to determine any association between the political donations data for all 338 ridings and other variables.
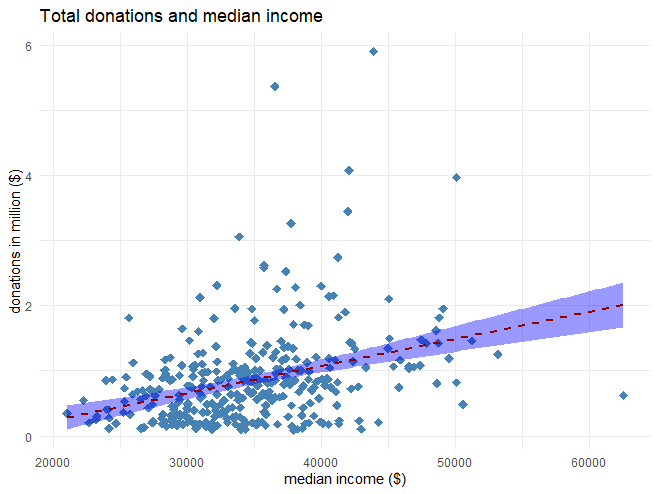
Q1: Was there a relationship between total donations greater than $200 and median income?
A: There was a positive relationship between total donations greater than $200 and median income. Every $10,000 increase in median income was associated with $0.42 million increase in total donations. Fifteen of the top 17 ridings had a median income higher than the national average.
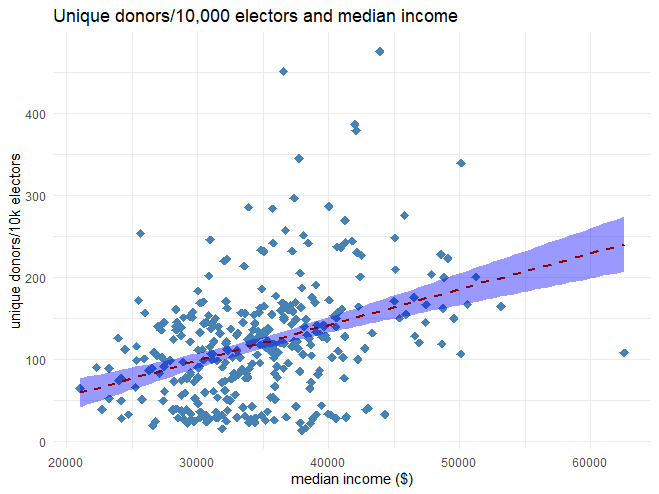
Q2: Was there a relationship between the number of unique donors per 10,000 electors and median income?
A: There was a positive correlation between the number of unique donors per 10,000 electors and median income. Each $10,000 increase in median income was associated with additional 44 unique donors per 10,000 electors.
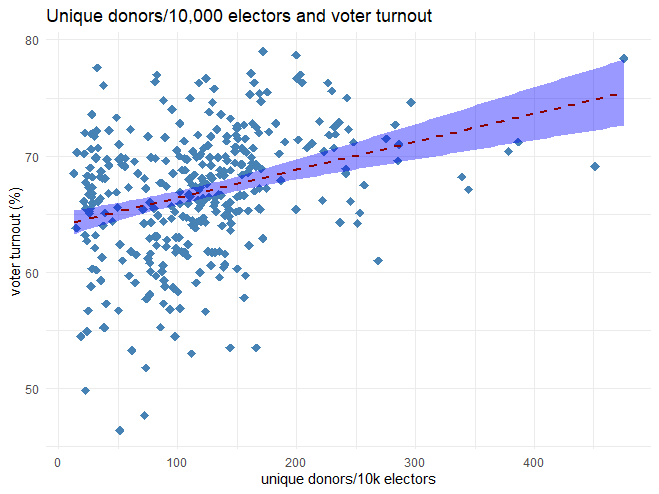
Q3: Was there a relationship between the number of unique donors per 10,000 electors and voter turnout?
A: There was a positive relationship between the number of unique donors per 10,000 electors and voter turnout. For a unit increase in the number of unique donors per 10,000 electors, we see a 0.024% increase in voter turnout.
The analysis of the top 17 ridings showed that:
- Fifteen ridings had higher-than-average median incomes, according to census data.
- Thirteen ridings had voter turnouts higher than the national voter turnout in the 2019 election.
- The federal Liberals raised the most money in 10 of the 17 ridings while the Conservatives led in six.The Green Party raised the most in Saanich-Gulf Islands, home of Green Party Leader Elizabeth May.
- Top-ranked Ottawa Centre had the highest number of donors who contributed more than $200, with 4,812 people, or 475 out of 10,000 eligible voters, reaching into their pockets to support political parties. Montreal’s Notre-Dame-de-Grâce—Westmount riding had the fewest donors of the 17 ridings, with 1,703 people contributing, or 222 donors per 10,000 eligible voters.
- Three of the 17 ridings are home to provincial legislatures, including Queen’s Park in University-Rosedale, the B.C. legislature in Victoria and the Alberta legislature in Edmonton Centre.