WHAT IS THE LOCAL NEWS DATA HUB?
The Local News Data Hub is committed to i) shoring up local journalism across Canada by supplying newsrooms with data-based stories ii) training student data journalists and iii) providing support to individual journalists and news organizations that require assistance with data analysis for their reporting projects.
The Data Hub’s reporting team, consisting of student data journalists and student data analysts supervised by faculty at X (also known as Ryerson) University, identifies government and other data with the potential to generate local stories. Once a dataset is identified and the basic reporting is done, the Data Hub team writes a story template and the code necessary to populate the template with data for specific communities. The local stories produced using this application of automated journalism are then posted on the LNDH website and also shared with the Canadian Press wire service for distribution to CP clients across the country. Find out more about the Local News Data Hub here.
ABOUT THE DATA
The internet speed test data used for this story were provided by the Canadian Internet Registration Authority (CIRA), a national not-for-profit organization that manages .ca internet domains and, in its words, is committed to “creating a secure, accessible and resilient internet, for all Canadians.”
The CIRA internet speed test can be accessed via its website. Since CIRA launched the platform in 2015, nearly one million tests have been performed by people who want to determine their connection speed.
While CIRA gave the Local News Data Hub access to all test results for 2020, it considers the raw data proprietary so we can only share the results of our analysis rather than the full data set.
Our goal was to compare the test data to the basic service objectives set for internet speed by the Canadian Radio-television and Telecommunications Commission (CRTC). The commission says Canadian households should have internet connections with access to broadband speeds of at least 50 megabits per second (mbps) for downloads and 10 mbps for uploads.
When asked how that minimum speed target was determined and why, this was the CRTC’s response:
“In establishing an appropriate speed criterion (50/10), the CRTC considered what was currently available to the vast majority of the population and what was likely to be required in the future for Canadians to have new and creative ways to participate in the digital economy. Moreover, many of Canada’s trading partners, such as the United States and members of the European Commission, were implementing digital strategies to achieve download speeds of 50 Mbps or more to enhance network infrastructures and to meet the growing demand for higher Internet speeds.”
DEFINITIONS
Download speed is the speed at which the user receives data from the Internet — for example, the speed at which a large file can be downloaded from a website. Higher speeds are more desirable, as it allows users to retrieve content, such as web pages, videos, files, or music more quickly.
Upload speed is the connection speed at which the user can send data including, for example, uploading a video to a social media website. Higher speeds can allow for pictures, music, and documents to be uploaded and shared more quickly.
Census subdivision (CSD) is the basic unit of geography for this study. It is Statistics Canada’s general term for a municipality. Please see the Statistics Canada definition for more information.
Census subdivision population data were added for each CSD using StatsCan census data.
THE DATA SET
People across Canada conducted 267,837 CIRA tests in 2,771 communities in 2020, but we limited the data to a subset of 68,813 tests conducted in 53 communities for two reasons.
Reason #1: We adjusted for supertester locations
To determine the number of unique locations in the test data, we created a unique geographic ID (GeoID) by combining each entry’s longitude and latitude. This allowed us to see how many unique locations there were in the test data.
While the majority of GeoIDs registeredonly a few tests over the course of 2020,there were tens, hundreds or even thousands of tests from some “supertester” locations. We needed to identify these locations/testers to ensure that tests from a single location did not skew the data for an entire community. To determine how many tests would constitute a “supertester” we generated a histogram using Python.
This histogram displayed the number of tests conducted by each GeoID and the frequency of each number of tests in the data set. When the line graph approaches the horizontal axis, that gives us an idea how many tests mark the defining point for what constitutes a supertester. After conferring with Dr. Murtaza Haider, director of Ryerson’s Institute for Urban Analytics and a member of the Data Hub’s editorial board, we determined that any GeoID with 40 tests or more would be designated a “supertester.”
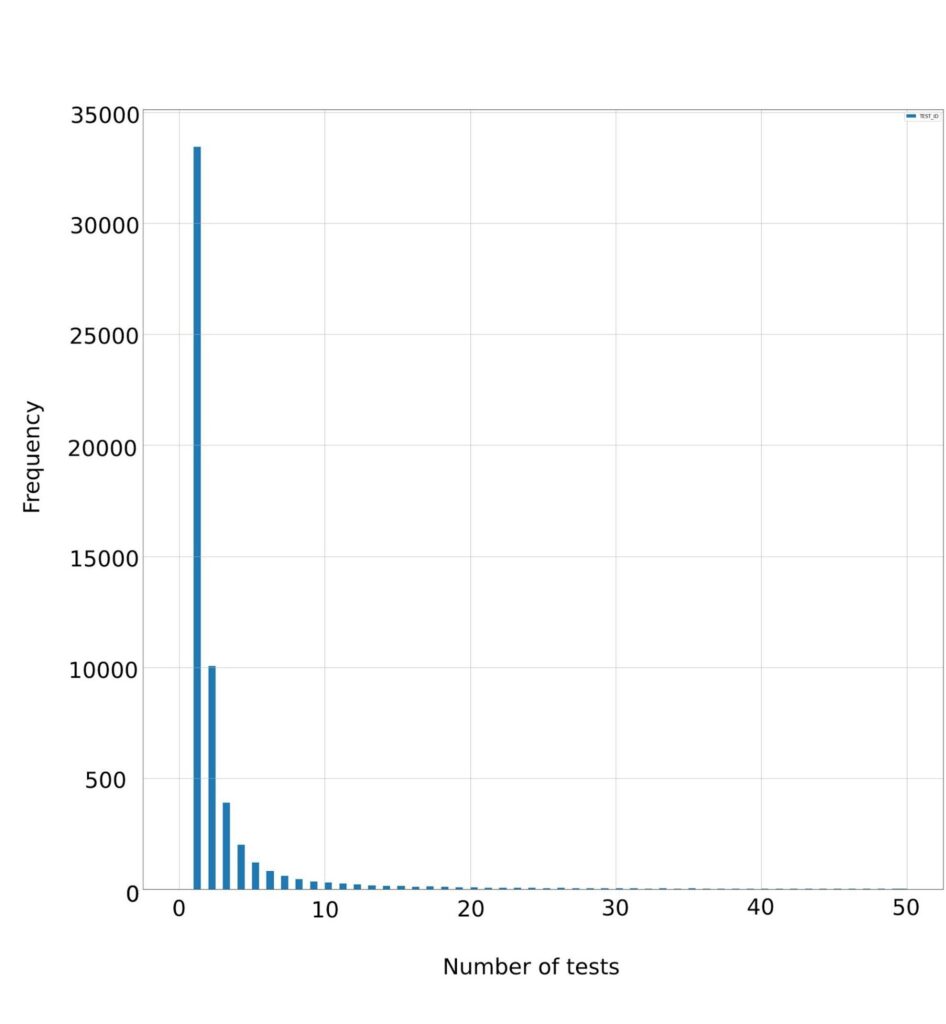
Having identified supertesters in the data set, we then calculated the median upload and download speeds of all the tests conducted by each supertester, assigned the median value to the supertester and counted that as one entry. This means that while a GeoID responsible for 39 tests would have 39 separate entries, a GeoID with 40 or more will only have one entry. In this way we made sure the supertesters did not unduly influence the results.
Reason #2: We included only communities where at least 500 tests were completed in 2020
To ensure we only reported on places where there were enough tests to provide an accurate snapshot of the upload and download speeds experienced by testers, we only included communities where at least 500 tests were conducted during the year. Dr. Haider also helped us arrive at this decision. His examination of the data indicated that a cut-off of at least 500 tests returned a subset of communities where the extent of variability in upload and download speeds could be deemed reasonable.
After the data were adjusted for supertesters, it included 140186 tests in 2,771 distinct communities for which one or more test results for upload and download speeds were available.
Very few tests were conducted in many of these communities – there were fewer than 10 tests in 1,561 census subdivisions. To determine the minimum number of tests required to provide a representative snapshot of the upload and download speeds experienced by testers in a community, we used the coefficient of variation (CV) as a proxy for the variability in the data set. CV is the ratio of standard deviation and mean of a variable. Lower values of CV suggest lower variability or variance in data.
We plotted CV against the number of tests per community in a scatter plot to determine whether CV changed with the number of tests conducted. A visual inspection of the plots suggested that CV for upload and download speeds stabilized with larger test numbers. Hence a cut-off of a minimum 500 tests was used to select communities for further analysis.
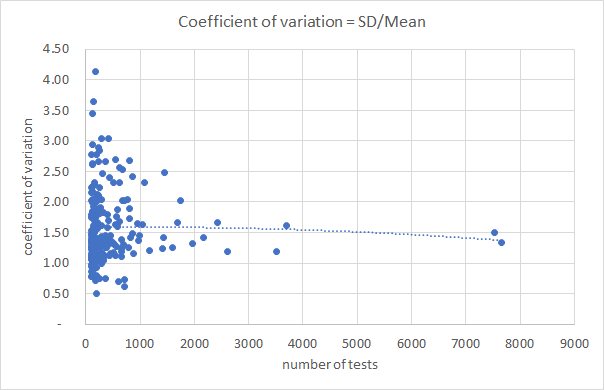
This resulted in a list of 53 CSDs with more than 500 tests. Using the unique ID numbers assigned to each CSD by Statistics Canada (CSDUIDs), we filtered the raw test data to produce a dataset consisting solely of tests in the communities with 500 or more tests.
In our analysis of the test data from the 53 CSDs, we calculated the median upload speed and median download speed of each CSD. We used median, rather than average (mean), to ensure that outliers did not affect test results. We also calculated the number of tests that failed to meet the CRTC download speed and upload speed minimums, and used that number to determine the percentage of tests that failed in each CSD.
TEST RESULTS FOR THE 53 COMMUNITIES
With the base analysis of the test results from the 53 CSDs finished, we were able to analyze the data in greater detail.
Our goal was to compare the test data to the basic service objectives set for internet speed by the Canadian Radio-television and Telecommunications Commission (CRTC). The commission says Canadian households should have internet connections with access to broadband speeds of at least 50 megabits per second (mbps) for downloads and 10 mbps for uploads.
Using pivot tables in Microsoft Excel, we calculated the number of tests and the median upload and median download speeds for each CSD. The percentage of tests in each CSD that met or exceeded the CRTC minimum internet speed targets (test results with upload speeds at or above 10 mbps and download speeds at or above 50 mbps) was also calculated.
| CSDUID | CSD Name | Prov. | Location description | Population (2016 Census) | # of tests | Median upload speed | Median download speed | % of tests at or above CRTC upload and download speed targets |
| 5915004 | Surrey | BC | 517,887 | 871 | 20.09 | 82.61 | 55% | |
| 2423027 | Québec | QC | 531,902 | 855 | 11.36 | 54.17 | 50% | |
| 4811061 | Edmonton | AB | 932,546 | 2612 | 14.905 | 67.555 | 47% | |
| 5915025 | Burnaby | BC | 232,755 | 586 | 15.445 | 51.815 | 45% | |
| 5917021 | Saanich | BC | 114,148 | 501 | 14.62 | 52.22 | 44% | |
| 3519028 | Vaughan | ON | 306,233 | 653 | 12.92 | 74.2 | 44% | |
| 3521010 | Brampton | ON | 593,638 | 1176 | 12.645 | 66.905 | 44% | |
| 2481017 | Gatineau | QC | 276,245 | 820 | 17.84 | 49.665 | 43% | |
| 3520005 | Toronto | ON | 2,731,571 | 7651 | 12.74 | 55.46 | 42% | |
| 5915022 | Vancouver | BC | 631,486 | 2159 | 14.84 | 49.43 | 41% | |
| 3539036 | London | ON | 383,822 | 1411 | 11.02 | 50.4 | 41% | |
| 3519036 | Markham | ON | 328,966 | 970 | 10.69 | 50.705 | 40% | |
| 4806016 | Calgary | AB | 1,239,220 | 3506 | 12.275 | 51.435 | 40% | |
| 4611040 | Winnipeg | MB | 705,244 | 1602 | 9.92 | 42.225 | 38% | |
| 3519038 | Richmond Hill | ON | 195,022 | 659 | 10.43 | 57.28 | 37% | |
| 3530013 | Kitchener | ON | 233,222 | 990 | 10.195 | 43.08 | 37% | |
| 3521005 | Mississauga | ON | 721,599 | 1972 | 10.365 | 46.02 | 36% | |
| 4711066 | Saskatoon | SK | 246,376 | 662 | 9.035 | 45.985 | 35% | |
| 1209034 | Halifax | NS | 403,131 | 1431 | 10.36 | 32.96 | 34% | |
| 3506008 | Ottawa | ON | 934,243 | 7536 | 9.96 | 38.22 | 34% | |
| 3530016 | Waterloo | ON | 104,986 | 524 | 10.295 | 54.385 | 33% | |
| 3510010 | Kingston | ON | 123,798 | 800 | 9.675 | 24.1 | 32% | |
| 3524001 | Oakville | ON | 193,832 | 661 | 10.16 | 40.93 | 32% | |
| 3553005 | Greater Sudbury | ON | 161,531 | 562 | 8.66 | 29.315 | 31% | |
| 2466023 | Montréal | QC | 1,704,694 | 3696 | 10.1 | 29.22 | 30% | |
| 3525005 | Hamilton | ON | 536,917 | 2423 | 8.41 | 28 | 24% | |
| 4706027 | Regina | SK | 215,106 | 690 | 6.685 | 23.555 | 23% | |
| 3544018 | Bracebridge | ON | Town immediately north of the town of Gravenhurst, north of Barrie | 16,010 | 717 | 1.53 | 15.56 | 23% |
| 4811052 | Strathcona County | AB | Specialized municipality immediately east of Edmonton | 98,044 | 614 | 5.105 | 15.85 | 21% |
| 3524002 | Burlington | ON | 183,314 | 1038 | 8.22 | 24.68 | 21% | |
| 3526053 | St. Catharines | ON | 133,113 | 570 | 9.155 | 33.26 | 19% | |
| 3521024 | Caledon | ON | Town immediately north of Brampton | 66,502 | 1744 | 1.205 | 9.12 | 18% |
| 3537016 | Essex | ON | Town south of Windsor | 20,427 | 777 | 1.86 | 10.77 | 16% |
| 3524009 | Milton | ON | 110,128 | 677 | 5.24 | 17.72 | 13% | |
| 3543068 | Tiny | ON | Township immediately west of the town of Midland, northwest of Barrie | 11,787 | 539 | 1.04 | 7.99 | 12% |
| 3544042 | Huntsville | ON | Town immediately North of the town of Bracebridge, north of Barrie | 19,816 | 796 | 0.91 | 6.52 | 10% |
| 3543023 | Oro-Medonte | ON | Township northeast of Barrie | 21,036 | 1454 | 0.98 | 5.925 | 10% |
| 3536020 | Chatham-Kent | ON | 101,647 | 502 | 1.96 | 11.985 | 10% | |
| 3519044 | Whitchurch-Stouffville | ON | Town immediately north of Markham | 45,837 | 579 | 0.71 | 13.99 | 8% |
| 3507065 | North Grenville | ON | Municipality immediately south of Ottawa | 16,451 | 678 | 0.97 | 7.18 | 7% |
| 4811059 | Sturgeon County | AB | Municipal district immediately north of Edmonton | 20,495 | 1080 | 1.55 | 9.065 | 6% |
| 3544053 | Muskoka Lakes | ON | Township west of the towns of Huntsville and Bracebridge and north of the town of Gravenhurst | 6,588 | 550 | 0.805 | 5.125 | 3% |
| 1212001 | Pictou, Subd. A | NS | Area north and west of the town of Pictou, including Pictou Island, along the Northumberland Strait | 6,075 | 616 | 0.51 | 1.78 | 1% |
| 3546018 | Algonquin Highlands | ON | Township in Haliburton County, east of the town of Huntsville, containing part of Algonquin Provincial Park | 2,351 | 613 | 0.76 | 4.24 | 1% |
| 3544027 | Lake of Bays | ON | Township in northeastern Muskoka, immediately east of the town of Huntsville | 3,167 | 541 | 0.94 | 5.8 | 1% |
| 3507021 | Leeds and the Thousand Islands | ON | Township surrounding the town of Gananoque, immediately east of Kingston, along the St. Lawrence River | 9,465 | 801 | 0.84 | 4.78 | 1% |
| 4805031 | Starland County | AB | Municipal district immediately north of the town of Drumheller, northeast of Calgary | 2,066 | 501 | 1.13 | 7.59 | 1% |
| 3546015 | Minden Hills | ON | Township in Haliburton County, immediately east of the town of Bracebridge | 6,088 | 960 | 0.62 | 3.275 | 0% |
| 4804012 | Special Area No. 3 | AB | Area surrounding the town of Oyen, east of Calgary, bordering Saskatchewan | 1,042 | 706 | 1.23 | 8.29 | 0% |
| 3546024 | Dysart et al | ON | Municipality in Haliburton County, north of Peterborough | 6,280 | 1681 | 0.63 | 3.26 | 0% |
| 4804004 | Special Area No. 2 | AB | Area surrounding the town of Hanna, immediately east of the town of Drumheller, east of Calgary | 1,905 | 709 | 1.2 | 7.72 | 0% |
| 3548094 | Nipissing, Unorganized, North Part | ON | Area in Nipissing District, immediately north of North Bay and Lake Nipissing | 1,784 | 788 | 0.52 | 0.72 | 0% |
| 4807019 | Stettler County No. 6 | AB | Municipal district surrounding the town of Stettler, east of Red Deer | 5,322 | 603 | 1.28 | 7.35 | 0% |
We also sorted the results by population to see if CSDs with higher populations had faster speeds than rural areas with lower populations.
| CSDUID | CSD Name | Prov. | Location description | Population (2016 Census) | # of tests | Median upload speed | Median download speed | % of tests at or above CRTC upload and download speed targets |
| 3520005 | Toronto | ON | 2,731,571 | 7651 | 12.74 | 55.46 | 42% | |
| 2466023 | Montréal | QC | 1,704,694 | 3696 | 10.1 | 29.22 | 30% | |
| 4806016 | Calgary | AB | 1,239,220 | 3506 | 12.275 | 51.435 | 40% | |
| 3506008 | Ottawa | ON | 934,243 | 7536 | 9.96 | 38.22 | 34% | |
| 4811061 | Edmonton | AB | 932,546 | 2612 | 14.905 | 67.555 | 47% | |
| 3521005 | Mississauga | ON | 721,599 | 1972 | 10.365 | 46.02 | 36% | |
| 4611040 | Winnipeg | MB | 705,244 | 1602 | 9.92 | 42.225 | 38% | |
| 5915022 | Vancouver | BC | 631,486 | 2159 | 14.84 | 49.43 | 41% | |
| 3521010 | Brampton | ON | 593,638 | 1176 | 12.645 | 66.905 | 44% | |
| 3525005 | Hamilton | ON | 536,917 | 2423 | 8.41 | 28 | 24% | |
| 2423027 | Québec | QC | 531,902 | 855 | 11.36 | 54.17 | 50% | |
| 5915004 | Surrey | BC | 517,887 | 871 | 20.09 | 82.61 | 55% | |
| 1209034 | Halifax | NS | 403,131 | 1431 | 10.36 | 32.96 | 34% | |
| 3539036 | London | ON | 383,822 | 1411 | 11.02 | 50.4 | 41% | |
| 3519036 | Markham | ON | 328,966 | 970 | 10.69 | 50.705 | 40% | |
| 3519028 | Vaughan | ON | 306,233 | 653 | 12.92 | 74.2 | 44% | |
| 2481017 | Gatineau | QC | 276,245 | 820 | 17.84 | 49.665 | 43% | |
| 4711066 | Saskatoon | SK | 246,376 | 662 | 9.035 | 45.985 | 35% | |
| 3530013 | Kitchener | ON | 233,222 | 990 | 10.195 | 43.08 | 37% | |
| 5915025 | Burnaby | BC | 232,755 | 586 | 15.445 | 51.815 | 45% | |
| 4706027 | Regina | SK | 215,106 | 690 | 6.685 | 23.555 | 23% | |
| 3519038 | Richmond Hill | ON | 195,022 | 659 | 10.43 | 57.28 | 37% | |
| 3524001 | Oakville | ON | 193,832 | 661 | 10.16 | 40.93 | 32% | |
| 3524002 | Burlington | ON | 183,314 | 1038 | 8.22 | 24.68 | 21% | |
| 3553005 | Greater Sudbury | ON | 161,531 | 562 | 8.66 | 29.315 | 31% | |
| 3526053 | St. Catharines | ON | 133,113 | 570 | 9.155 | 33.26 | 19% | |
| 3510010 | Kingston | ON | 123,798 | 800 | 9.675 | 24.1 | 32% | |
| 5917021 | Saanich | BC | 114,148 | 501 | 14.62 | 52.22 | 44% | |
| 3524009 | Milton | ON | 110,128 | 677 | 5.24 | 17.72 | 13% | |
| 3530016 | Waterloo | ON | 104,986 | 524 | 10.295 | 54.385 | 33% | |
| 3536020 | Chatham-Kent | ON | 101,647 | 502 | 1.96 | 11.985 | 10% | |
| 4811052 | Strathcona County | AB | Specialized municipality immediately east of Edmonton | 98,044 | 614 | 5.105 | 15.85 | 21% |
| 3521024 | Caledon | ON | Town immediately north of Brampton | 66,502 | 1744 | 1.205 | 9.12 | 18% |
| 3519044 | Whitchurch-Stouffville | ON | Town immediately north of Markham | 45,837 | 579 | 0.71 | 13.99 | 8% |
| 3543023 | Oro-Medonte | ON | Township northeast of Barrie | 21,036 | 1454 | 0.98 | 5.925 | 10% |
| 4811059 | Sturgeon County | AB | Municipal district immediately north of Edmonton | 20,495 | 1080 | 1.55 | 9.065 | 6% |
| 3537016 | Essex | ON | Town south of Windsor | 20,427 | 777 | 1.86 | 10.77 | 16% |
| 3544042 | Huntsville | ON | Town immediately North of the town of Bracebridge, north of Barrie | 19,816 | 796 | 0.91 | 6.52 | 10% |
| 3507065 | North Grenville | ON | Municipality immediately south of Ottawa | 16,451 | 678 | 0.97 | 7.18 | 7% |
| 3544018 | Bracebridge | ON | Town immediately north of the town of Gravenhurst, north of Barrie | 16,010 | 717 | 1.53 | 15.56 | 23% |
| 3543068 | Tiny | ON | Township immediately west of the town of Midland, northwest of Barrie | 11,787 | 539 | 1.04 | 7.99 | 12% |
| 3507021 | Leeds and the Thousand Islands | ON | Township surrounding the town of Gananoque, immediately east of Kingston, along the St. Lawrence River | 9,465 | 801 | 0.84 | 4.78 | 1% |
| 3544053 | Muskoka Lakes | ON | Township west of the towns of Huntsville and Bracebridge and north of the town of Gravenhurst | 6,588 | 550 | 0.805 | 5.125 | 3% |
| 3546024 | Dysart et al | ON | Municipality in Haliburton County, north of Peterborough | 6,280 | 1681 | 0.63 | 3.26 | 0% |
| 3546015 | Minden Hills | ON | Township in Haliburton County, immediately east of the town of Bracebridge | 6,088 | 960 | 0.62 | 3.275 | 0% |
| 1212001 | Pictou, Subd. A | NS | Area north and west of the town of Pictou, including Pictou Island, along the Northumberland Strait | 6,075 | 616 | 0.51 | 1.78 | 1% |
| 4807019 | Stettler County No. 6 | AB | Municipal district surrounding the town of Stettler, east of Red Deer | 5,322 | 603 | 1.28 | 7.35 | 0% |
| 3544027 | Lake of Bays | ON | Township in northeastern Muskoka, immediately east of the town of Huntsville | 3,167 | 541 | 0.94 | 5.8 | 1% |
| 3546018 | Algonquin Highlands | ON | Township in Haliburton County, east of the town of Huntsville, containing part of Algonquin Provincial Park | 2,351 | 613 | 0.76 | 4.24 | 1% |
| 4805031 | Starland County | AB | Municipal district immediately north of the town of Drumheller, northeast of Calgary | 2,066 | 501 | 1.13 | 7.59 | 1% |
| 4804004 | Special Area No. 2 | AB | Area surrounding the town of Hanna, immediately east of the town of Drumheller, east of Calgary | 1,905 | 709 | 1.2 | 7.72 | 0% |
| 3548094 | Nipissing, Unorganized, North Part | ON | Area in Nipissing District, immediately north of North Bay and Lake Nipissing | 1,784 | 788 | 0.52 | 0.72 | 0% |
| 4804012 | Special Area No. 3 | AB | Area surrounding the town of Oyen, east of Calgary, bordering Saskatchewan | 1,042 | 706 | 1.23 | 8.29 | 0% |
INFORMATION ON INTERNET SPEED PACKAGES PURCHASED BY USERS
In our data set, some users also submitted information on their internet service provider and the package they had subscribed to including details of their contracted upload and download speeds. Contract speeds that included greater than or less than symbols were excluded from the analysis.
Contracted upload and download speeds were both included for 11,385 tests in the 53 CSDs. Comparing speed test results with contract speeds showed that the contracted upload and download speeds were delivered in only nine per cent of cases.
| Did speed test results meet or exceed contracted upload and download speeds? | ||
| # of tests | % of tests | |
| Yes | 993 | 9% |
| No | 10,392 | 91% |
| Total tests that included both upload and download contract speeds | 11,385 |
DATA LIMITATIONS
The data is not representative of all internet service within communities. Only internet speeds for individuals who chose to use CIRA’s Internet Performance Test are represented in the data.
The data also does not account for other factors that influence internet speed, such as the type of device being used, the number of applications running, and the number of devices that are online at the same time. The upload and download speeds contracted with internet service providers can also limit internet speeds.
Additionally, contracted speeds were manually entered by users who completed speed tests and the data are reliant on users accurately identifying their contract speeds.